
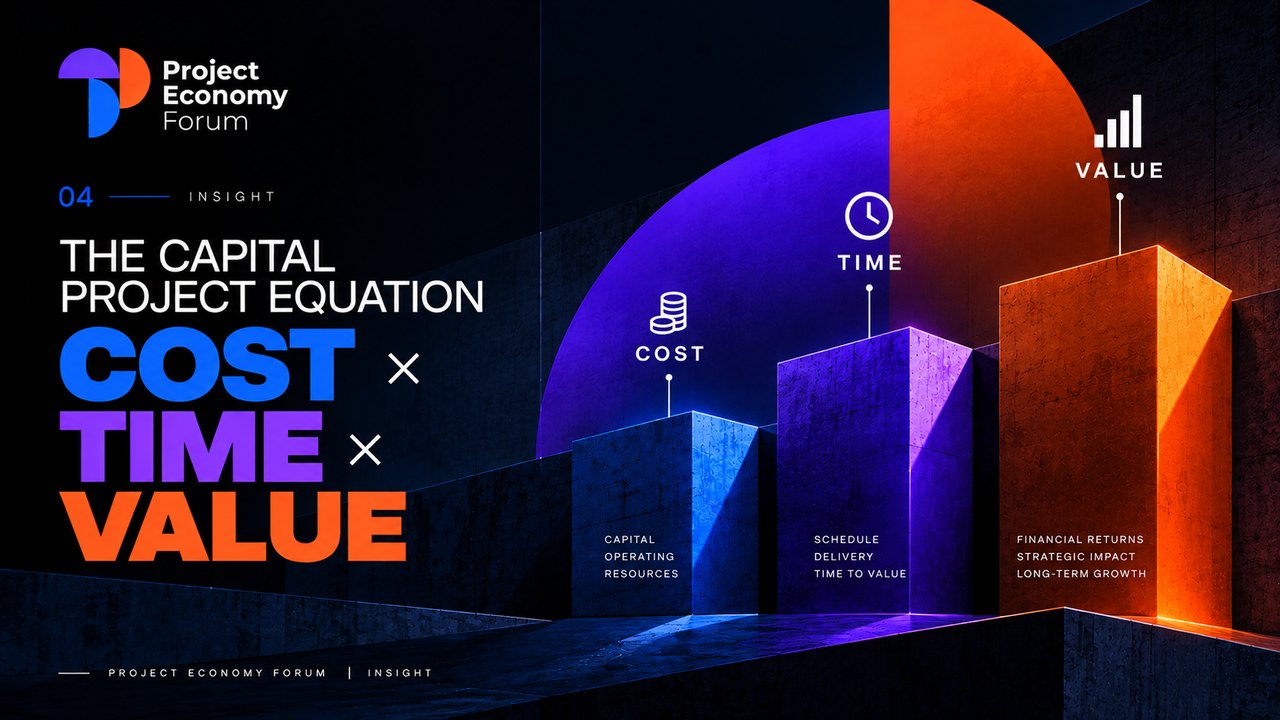
Ask a board whether a capital project succeeded and the answer usually arrives as two numbers: final cost against budget, and completion date against plan. Both matter. Neither is the point. A capital project exists to create an asset that produces something, whether capacity, output, revenue or a public service, and its performance depends on three things together: the capital it consumes, the time it takes to reach productive use, and the value it generates once it is running.
How, then, should executives measure capital project performance? Our answer is to treat it as an equation: cost × time × value. It is not a literal formula but a discipline, and the multiplication sign is deliberate. Strength in one term does not offset weakness in another. A project delivered on budget but two years late has lost two years of output. A project on time and on budget that produces an underused asset has turned capital into a liability. Only when all three terms hold does the investment case hold.
The equation changes what project controls are for. Tracking spend and progress against a baseline remains essential, but it is not enough. Controls also need to price delay rather than merely report it, carry the value case alongside the cost and schedule baselines, and follow the asset through handover into operation, which is where value is realised or lost.
In brief
- Judge the three terms together. If roughly one megaproject in ten is on budget, one in ten on schedule and one in ten on benefits, then about one in a thousand succeeds on all three (Flyvbjerg, Project Management Journal, 2014).
- Time is a cost. Across a large set of major construction projects, each one-year extension of the implementation phase was associated on average with about 4.6 percentage points more cost overrun (Flyvbjerg, 2014, summarising earlier research).
- Earned value measures delivery, not worth. Earned value management integrates scope, schedule and resources, but it cannot say whether the finished asset will justify its capital.
- Value leaks between spending and service. The IMF’s cross-country work on public investment finds that a material share of the potential gains is lost to inefficiencies in the investment process itself (IMF, Making Public Investment More Efficient, 2015).
- Handover settles the equation. Operational readiness has to be planned and controlled from the start, not left to the final months.
Why on time and on budget is not enough
The traditional test of a project, delivered to cost, schedule and specification, measures project management. It does not measure the investment. Flyvbjerg’s review of megaproject performance makes the point numerically. Success is typically defined as delivery on budget, on time and on benefits; if, as the evidence indicates, about one in ten megaprojects meets each test, then only about one in a thousand meets all three. Even if those figures were wrong by a factor of two, the success rate would be eight in a thousand (Flyvbjerg, What You Should Know About Megaprojects and Why, 2014).
The same gap appears at national scale, where the IMF’s evidence on how much of the growth effect of public investment is lost to weak processes is set out in our analysis of what projects do to economies. Our reading is that this gap, between capital spent and value delivered, is exactly what cost and schedule reporting alone cannot see.
The table below sets out what each term of the equation means in practice, and where organisations tend to lose sight of it.
| Term | What it captures | Measured during delivery by | Common blind spot |
|---|---|---|---|
| Cost | Capital consumed, including contingency, financing and owner’s costs | Cost performance against a controlled baseline; estimate at completion | A baseline set on an immature estimate, so variances measure the forecast, not performance |
| Time | Time until the asset is productive, not merely complete | Schedule performance; critical path and risk-adjusted completion | Reporting delay in weeks rather than in money and deferred benefits |
| Value | Output, revenue, service or capability delivered in operation | Readiness milestones; benefits forecast kept under change control | Value treated as fixed at approval and not re-tested as markets and demand move |
Cost: only as meaningful as the baseline
Cost performance is the most mature of the three measures, and the most easily misread. A cost variance compares actual spending with a plan; if the plan was unrealistic, the variance says more about the estimate than about the delivery team. The UK National Audit Office notes that, even once contracts are in place, estimates still carry risk and uncertainty, and that it is not always possible to see whether bodies can distinguish cost increases caused by better estimates from those caused by poor delivery performance (NAO, Lessons Learned from Major Programmes, 2020).
That distinction matters to a chief financial officer. An overrun caused by a baseline that was always too low calls for better front-end practice; an overrun caused by weak delivery calls for intervention in the project. Treating them as the same thing produces the wrong remedy. Why so many baselines are wrong from the start, through optimism bias, strategic misrepresentation and immature estimates, is examined in our companion piece on why capital projects fail before construction begins.
Time: the term most boards underprice
Delay is usually reported in weeks or months. It should be reported in money. Flyvbjerg’s review summarises earlier research on a large dataset of major construction projects which found that, on average, a one-year delay or other extension of the implementation phase correlates with an increase in cost overrun of about 4.6 percentage points. He illustrates the scale using London’s Crossrail, then a USD 26 billion project: on that model, a one-year delay would cost about USD 1.2 billion extra, or USD 3.3 million a day (Flyvbjerg, 2014). The lesson he draws is to keep implementation phases short, not by rushing decisions but by planning thoroughly before committing.
The effect compounds when a project is financed with debt. Interest accrues while there is no revenue to service it, and projects can fall into what Flyvbjerg calls a “debt trap”. The Channel Tunnel is his example: construction costs ran 80% over budget and financing costs 140%, revenues were half of those forecast, and the internal rate of return on the investment was negative, at minus 14.5% (Flyvbjerg, 2014). Flyvbjerg acknowledges that the service itself is fast and convenient; as an investment, time and value turned against it.
For executives, the practical concept is the cost of delay. For any asset, a month of delay typically carries three costs: time-related spending such as site overheads, supervision and financing continues; the stream of benefits the asset was built to produce is deferred; and some benefits may be lost for good if demand, prices or policy move in the meantime. Our view is that every major project should carry a current estimate of its cost of delay per month, approved by the finance function, so that acceleration, re-sequencing and scope decisions can be priced rather than argued.
Time pressure has its own failure mode. The NAO lists warning signs that a schedule is becoming unrealistic: persistent re-planning to meet the same deadline, removal of scope or benefits, shortening the time allotted for testing, unplanned last-minute staging, and a focus on individual risks rather than the programme’s total risk. On Crossrail, it found that decision-making in the later stages was dominated by a fixed completion date, and that some of those decisions drove unnecessary cost into the programme (NAO, 2020). The cost of delay is real, but so is the cost of pretending a date is still achievable.
Value: the term rarely under control
Value is where long projects are most exposed, because the world changes while they are being built. Crossrail, now the Elizabeth line, shows all three terms moving at once. In 2021 the NAO reported a forecast cost of £18.9 billion including Network Rail’s costs, a 28% nominal increase on the 2010 budget of £14.8 billion, and central section services expected at least three years after the original December 2018 opening date. The sponsors’ most recent estimate of the transport benefit–cost ratio, from March 2020, was £1.37 for every £1, rising to £1.88 when wider economic benefits were included (NAO, Crossrail: a progress update, 2021).
The NAO also found that the expected benefits rested on forecasts of population and travel demand set in 2011 and 2015, which might be less likely to materialise, at least in the short term. Transport for London’s scenario planning in January 2021 indicated an 18% drop in rail demand by 2031, with a potential longer-term revenue risk of around £150 million a year if demand for the line grew more slowly than expected. The NAO found that TfL did not yet have a strategy and plan for realising and maximising the line’s benefits, and recommended one. The line’s central section opened on 24 May 2022 (Transport for London, 2022).
The lesson is not that Crossrail should not have been built; that judgement lies outside this article. It is that value is a variable during delivery, not a constant fixed at approval. A value forecast that is not kept under change control, with a named owner, will simply be discovered, well or badly, after handover.
Project controls that measure all three terms
What earned value tells you, and what it does not
Earned value management is the established tool for integrating the cost and time terms. The Project Management Institute defines it as a methodology for integrating scope, schedule and resources, objectively measuring project performance and progress, and forecasting project outcome (PMI, The Standard for Earned Value Management, 2019). In the EIA-748 standard for earned value management systems, 32 guidelines are organised into five categories: organisation; planning, scheduling and budgeting; accounting considerations; analysis and management reports; and revisions and data maintenance (NDIA, EIA-748-D Intent Guide, 2018).
The core indices are simple. The cost performance index divides the budgeted cost of work performed by its actual cost; below 1.0 is unfavourable. The schedule performance index divides the budgeted cost of work performed by the budgeted cost of work scheduled. The Association for Project Management notes that the schedule index tends towards 1.0 as a project progresses and is of less value as the project nears completion (APM, Earned Value Management Handbook, 2013), because by the end all planned work has been earned, however late. PMI’s standard has also broadened the definition of value in earned value management to include the concept of earned schedule.
What earned value does not measure is worth. “Earned value” is the budgeted cost of work performed. A project can earn its full value on schedule while building an asset whose market has shrunk. Earned value is necessary for the cost and time terms; it is silent on the third.
Leading indicators, not progress reports
The NAO has found that bodies do not always consider which information could act as a leading indicator of emerging problems. On Crossrail, progress reports to the board and sponsors emphasised what had been achieved rather than the level of risk remaining. The NAO’s 2021 report adds a telling detail: despite contractors meeting only around 30% of milestones on average through 2019 and early 2020, Crossrail Ltd continued to base its plans on more optimistic levels of productivity. After re-planning, contractors met around 90% of milestones between September 2020 and April 2021 (NAO, 2021). Plans built on demonstrated productivity, as the NAO recommends, are more credible than plans built on hope.
Putting value into the control system
The logical next step is to carry value alongside cost and time. In practice, that means four additions:
- A benefits baseline, approved at the investment decision and changed only through formal change control, as cost and schedule baselines are.
- A cost-of-delay rate, updated at each forecast, so that schedule variance is also reported in money and deferred benefits.
- Readiness milestones in the integrated schedule, covering testing, commissioning, operator training and regulatory approvals, so that time to value, not merely time to completion, is on the critical path.
- A named value owner, usually in the operating business, who reports the benefits forecast to the same forum that reviews cost and schedule.
Handover: where the equation is settled
Handover is where cost and time stop accumulating and value starts, or fails to. The NAO found that bodies often underestimate the complexity of bringing a programme into use and may not begin planning for operations until the programme is nearly complete. On Thameslink, the rail industry did not start planning early enough for the transition to the enhanced services, and in May 2018 there was severe disruption on the network in the region, which the NAO attributes to deficiencies in planning their introduction (NAO, 2020). On Crossrail, neither the delivery company, the sponsors nor the contractors had appreciated how complex it would be to bring together the separate systems and assets and assure them as safe and working; the company estimated some 500,000 individual assets and 200,000 assurance documents (NAO, 2021).
Operational readiness is therefore a delivery workstream, not a post-project activity, and it belongs in the control system from the investment decision onwards. What happens after handover, from asset utilisation to benefits realisation and post-project accountability, is the subject of our article on turning projects into productive assets.
What executives should ask for
For chief executives, chief financial officers and heads of capital projects, the equation translates into a short list of reporting requirements:
- One view of all three terms at every board or investment committee review, not separate cost, schedule and business case reports produced by different functions.
- The cost of delay per month, so that the value of acceleration and the price of slippage are explicit.
- A statement of baseline credibility: the maturity of the estimate at the investment decision, and how much of any variance reflects estimate error rather than delivery performance.
- Forward-looking forecasts: estimate at completion and risk-adjusted completion dates, not only period performance.
- A post-handover review at a defined point, comparing the asset’s actual output and benefits with the business case that justified it.
These are the questions that sit at the heart of project controls and delivery performance, and they only work if the controls function has access to value data held elsewhere in the organisation.
One equation, every function
The equation is not confined to engineering. Portfolio leaders can use it to compare projects by the value they generate per unit of capital and per year of delivery, a lens that fits portfolio management’s move beyond project selection. Finance and governance teams can tie staged funding releases to the controls data, releasing capital as delivery confidence is demonstrated, as set out in how organisations connect capital to projects. And technology and transformation programmes, where benefits often depend on adoption as much as delivery, face the same three terms with a shorter clock; the same questions apply to technology and transformation investment.
The equation in the project economy
Project Economy Forum describes the life of a project as Decide → Fund → Deliver → Prove, and the equation maps onto it closely. The baseline for cost and time is set when the project is decided and funded. Cost and time are consumed in delivery. Value is proven, or not, in operation. An organisation that measures only the delivery step is managing one-third of the equation. Seen whole, the project economy is about converting capital into productive assets as efficiently and quickly as the work allows, and then proving that it did.
That full sequence, from first decision to final proof, is what the second day of the Forum’s Dubai edition on 27–28 January 2027 follows on a single stage, with capital projects and CAPEX as one of its eight areas.
Measuring the clock that matters
The most useful change a board can make may be to its definition of “finished”. Project reporting often stops the clock at completion or handover. The investment case stops it when the asset reaches its intended performance. The months or years between the two, spent in testing, commissioning, ramp-up and early operation, are often unreported, unowned and uncosted, yet they sit squarely inside the time term and determine the value term. A capital project should not be reported as complete until the asset is doing what the capital was committed for.
Frequently asked questions
What is the capital project equation?
It is a way of judging capital projects on cost, time and value together: the capital consumed, the time until the asset is productive, and the value it delivers in operation. The multiplication signals that a shortfall in one term is not offset by performance in another.
What is earned value management?
Earned value management is a project control methodology that integrates scope, schedule and resources, measures performance by comparing the budgeted cost of work performed with the work planned and the actual cost incurred, and forecasts final cost and completion. It measures delivery efficiency, not the business value of the asset.
What is the cost of delay in a capital project?
It is the money lost for each period a project is late: continuing time-related costs such as overheads and financing, benefits deferred because the asset is not yet operating, and any benefits permanently lost as conditions change. Estimating it lets executives price schedule decisions rather than debate them.
Sources
- Bent Flyvbjerg, What You Should Know About Megaprojects and Why: An Overview, Project Management Journal (2014). arXiv
- International Monetary Fund, Making Public Investment More Efficient (2015). IMF
- National Audit Office, Lessons Learned from Major Programmes, HC 960 (2020). NAO
- National Audit Office, Crossrail: a progress update, HC 299 (2021). NAO
- Transport for London, All aboard the transformational Elizabeth line, press release (2022). TfL
- Project Management Institute, The Standard for Earned Value Management (2019). Google Books
- Pinnacle Management Systems, New ANSI Standard for Earned Value Management Published (2020). Pinnacle
- National Defense Industrial Association, Earned Value Management Systems EIA-748-D Intent Guide (2018). NDIA
- Association for Project Management, Earned Value Management Handbook, sample chapter (2013). APM